When it comes to website performance, everything boils down to Page Experience.
Since 2021 when the Google core web vitals have been rolled out, adept shift on user experience has been recognised and given priority by search Engines. And this is just the beginning.
So, whether it’s page experience for Google or user, websites need to strike a balance between the two for ultimate website performance.
From performance monitoring to testing, keep reading to understand all the how to’s related to website performance.
How and Why do Website Performance Matters?
Website performance plays a critical role in user experience, search engine rankings, and overall website success.
So, what do you mean by website performance?
Website performance refers to the speed, responsiveness, and overall user experience of a website.
It encompasses various factors such as page load times, server response times, and how quickly the website responds to user interactions.
Why and how does website performance matters?
- Website performance is important for user experience
A fast-loading website can greatly improve user satisfaction and engagement.
Studies show that visitors are more likely to leave a website that takes more than three seconds to load, leading to high bounce rates and reduced conversions.
In contrast, a fast-loading website can improve engagement, increase time spent on site, and lead to higher conversion rates.
- Website performance is a critical factor in SEO
Search engines prioritize fast-loading websites in their rankings, which can lead to higher visibility, more traffic, and ultimately more conversions.
A slow-loading website can have a negative impact on search engine rankings and reduce overall website visibility.
- Website Performance impacts website conversions
A website that loads quickly and functions smoothly can improve the overall user experience and increase the likelihood of conversions.
On the other hand, a slow or unresponsive website can reduce trust and confidence in a brand, leading to reduced conversions and revenue.
How to Measure Website Performance from Google’s point of View?
This question is tricky as there are a lot of performance metrics that need to be considered but we’ll be focussing on the latest and most important Core Web Vitals.
Since June 2021 till today, Core Web Vitals continue creating hype in the SEO and web development industry and are the heavily searched topics.
Let’s discuss in detail by taking an example on how CWV help in website performance monitoring.
Google primarily focuses on these three pillars for measuring website performance.
- Loading Speed (How fast content appears on screen?)
- Response Time (Time taken to respond to user input)
- Visual Stability (the stability of the web elements while loading)
To measure these three metrics, three unique parameters are defined which are known as Core Web Vitals. Let’s have a look.
Largest Contentful Paint (LCP)
LCP measures the time taken to load the largest piece of content on a webpage.
This can be an image, video, or block of text. LCP is important because it impacts the perceived loading speed of a webpage.
A fast LCP means the user can see the main content of the page quickly, which improves user experience and engagement. A slow LCP can lead to frustration and high bounce rates.
Good LCP score: less than 2.5 seconds
Bad LCP score: more than 4 seconds
Let’s understand with an example:
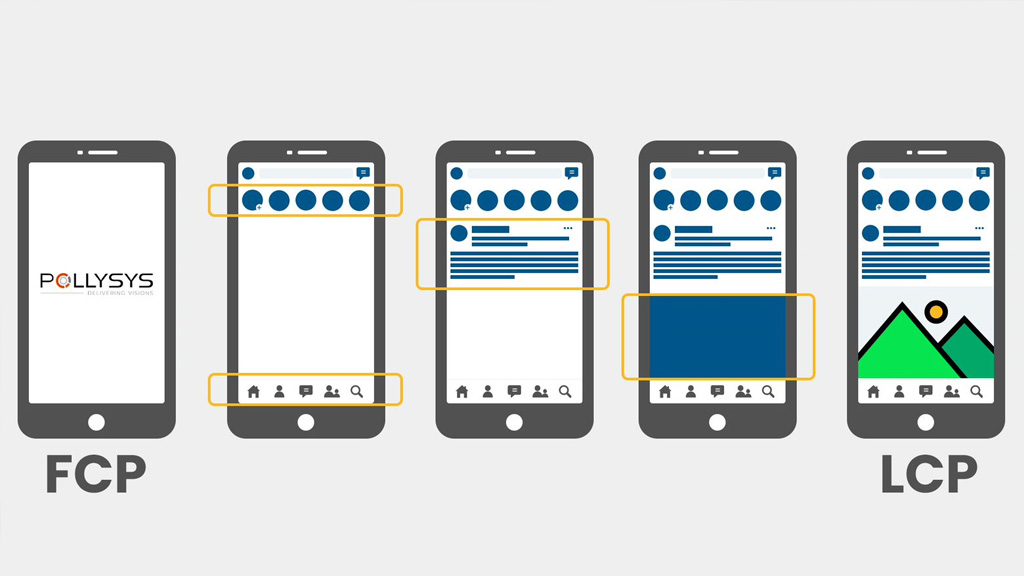
Refer the picture. The first content that loads on the webpage is called FCP or First Contentful Paint but it may or may not be the largest.
If you check the second last screen. It holds a space for the image which is the largest content of the page. This is called LCP.
The time to load this LCP should be under 2.5 seconds for a better user experience and good website performance.
Website performance testing for LCP
To measure LCP, you can use various web performance testing tools. Here’s a step-by-step guide on how to measure LCP using Google’s PageSpeed Insights:
- Go to PageSpeed Insights.
- Enter your website’s URL and click “Analyze.”
- Wait for the analysis to complete.
- Scroll down to the “Largest Contentful Paint” section.
- Check the “Performance Score” for LCP. The score ranges from “Good” to “Needs Improvement” to “Poor.”
- Check the “LCP” value in seconds. This value represents the time it takes for the largest piece of content on your webpage to load.
Alternatively, you can also use Google’s Chrome DevTools to measure LCP. Here’s how:
- Open Google Chrome and go to your website.
- Right-click anywhere on the webpage. Select “Inspect.”
- Click on the “Performance” tab.
- Click on the “Reload” button to start recording.
- Wait for the recording to complete.
- Check the “Summary” section to see the LCP value in seconds.
By measuring LCP using these tools, you can get a better understanding of your website’s performance and identify areas for improvement.
First Input Delay (FID)
Experiencing a delay after clicking any button on the website while it is still loading? This is First Input Delay or FID.
FID is one of the most critical and essential website performance metrics that measures how long it takes for the browser to respond to a user’s first interaction with the webpage.
This interaction could be a tap, click, or keypress, scroll, browsing action etc., and a faster response time leads to a more responsive webpage.
Delays in responsiveness can cause frustration among users and can make your website feel sluggish.
With websites becoming more complex and powered by JavaScript, it’s vital to focus on FID to speed up the process between getting content on the screen and making it interactive.
The FID measures all interactions that happen during the loading of the page, making it an essential metric to optimize for a better user experience.
Good FID score: less than 100ms
Bad FID score: more than 300ms
Website performance testing for FID
Something which you need to note is that you directly cannot predict on FID if there is no user interaction.
The Google search console will directly prompt “no data” found. Google needs data from the real user or what we call it as field data. Lab data or simulated data will not work here.
Usually, to improve this course it’s the JavaScript which is the prime culprit behind the low FID scores. Undoubtedly JavaScript help us to build some amazing interactions but results in slowing of the websites due to its complex code.
JavaScript is a client-side script, so the entire burden comes on the browser and the browser takes time to respond until it has finished executing JavaScript.
So, by working on the JavaScript code and optimising it or removing unused JavaScripts help you improve on your scores. Thereby improving your overall page experience and website performance.
Google’s PageSpeed insights is an awesome performance testing website by Google. You can check your scores there or from Google search console and Google’s Chrome DevTools.
Cumulative Layout Shift (CLS)
You must have often have seen websites loading the text content first and thereafter, the entire section shifts down suddenly as an image needs to be displayed.
This visual shift is irritating and frustrating for the users as the users have already started interacting with the first loaded content and did not expect anything else would disrupt their browsing.
This is Cumulative Layout Shift or CLS and it measures the amount of visual layout shifting that occurs on a webpage as it loads.
Reason of visual shifting?
- This can happen when images, ads, or other elements load after the initial content, causing the page to jump around.
- Other reason could be, there are no designated/dedicated places set for ads, text and images which directly impacts the visual stability of a webpage.
A low CLS means the webpage is visually stable and user-friendly, which improves user experience and engagement. A high CLS can lead to frustration and poor user experience.
Good CLS score: less than 0.1
Bad CLS score: more than 0.25
Checking website performance for CLS
Same tools are used for all web core vital metrics. You need to check that score and the performance rating should indicate green colour. If it’s red or yellow, it means the website needs to improve on that.
Continue reading to learn some important website performance monitoring tools.
How to Measure Website Performance from User’s point of View?
Being a normal user, how can you analyse a website’s performance?
Definitely, content is the real player, but it doesn’t talk about the website performance. We’re concerned about the page experience part.
Here are some vital signs to look out for when you are analysing a website performance and best user experience.
➤ Website loads quickly:
Nobody likes waiting for a website to load, and slow load times can cause people to get frustrated and leave the site.
Tools like Google PageSpeed Insights to see how fast our website loads and identify areas for improvement.
➤ Website is mobile-friendly
More than half of the web traffic comes from mobile devices. With the rise of mobile usage, it’s important to ensure that your website is mobile-friendly.
This means that your website should be optimized for mobile devices and have a responsive design that adapts to different screen sizes.
Google offers a mobile-friendly test that can help you evaluate your website’s mobile-friendliness.
➤ Website is secure: HTTPS
HTTPS is a way to encrypt data that’s sent between a website and a user’s browser, so it’s really important for keeping things like passwords and credit card numbers safe.
We can use tools like SSL Labs to check if our website is using HTTPS properly.
➤ Navigation experience:
Website’s navigation should be intuitive and easy to use. Users should be able to quickly find what they’re looking for without having to click through multiple pages.
You can use tools like Google Analytics to analyse user behaviour and identify areas for improvement in your website’s navigation.
➤ Website is accessible to everyone
The website should be accessible to everyone who is using the internet including people with disabilities. This means making sure that things like text and images are easy to read and use with a keyboard.
Tools like WAVE can help identify areas which needs improvement on accessibility.
Website Performance Testing Tools
These tools can help you identify areas of improvement for your website performance and help you optimize it for better user experience.
👉 Google PageSpeed Insights:
This tool analyses website performance and provides suggestions for improvement. It also provides scores for both mobile and desktop versions of the website.
👉 GTmetrix:
This tool provides detailed reports on website performance, including page speed, page size, and requests. It also provides suggestions for improvement.
👉 Pingdom:
This tool monitors website uptime and provides performance reports, including page speed, page size, and requests. It also provides alerts if the website goes down.
👉 WebPageTest:
This tool allows you to test website performance from different locations and browsers. It provides detailed reports on website performance, including page speed, load time, and waterfall charts.
👉 Lighthouse:
This is an open-source tool by Google that is used as a browser extension or as a command-line tool. It provides audits on website performance, accessibility, and best practices.
👉 Google Search Console:
Google Search Console (formerly Google Webmaster Tools) is a free tool that provides website owners with a variety of insights into how their website is performing in Google’s search results.
One of the features of Google Search Console is the Core Web Vitals report, which provides information on how users experience your website’s loading performance, interactivity, and visual stability.
In addition to these tools, there are a number of other factors that you can consider when evaluating the performance of your website. These include:
- The size of your website’s files: The larger your website’s files, the longer it will take to load.
- The number of images on your website: Images can take a long time to load, so it’s important to optimize them for the web.
- The use of third-party scripts and plugins: Third-party scripts and plugins can slow down your website, so it’s important to use them sparingly.
- The hosting provider you use: The hosting provider has a big impact on the performance of your website.
By using the tools and factors listed above, website performance can be improved and provide a better user experience for the visitors.
Bottom Line
Analysing website performance is crucial to ensure a positive user experience, improve search engine rankings, and achieve business goals.
By monitoring core web vitals and other key metrics, using the right tools and techniques, and continuously optimizing website performance, you can ensure that the website delivers fast, reliable, and engaging experiences to your users.
So, start analysing your website performance today and make the necessary changes to take your website to the next level!
Always remember, adept focus on your users will help build awesome websites.